[an error occurred while processing this directive]
CCHRC Research and Testing Facility (RTF)
Roof Insulation Monitoring
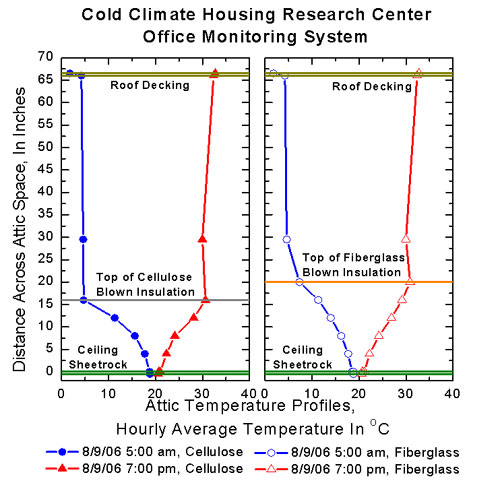
Figure 1. The above graph shows the temperature profile through
the two types of insulation for an example day in September, 2006. The diurnal
(daily) variation in cold nightime and warm afternoon temperatures is shown by
the two sets of temperature lines. The effective of the R60 insulation between
the two types of insulation can be seen by the temperature at the base of the
insulation, which is close to be being the same. The temperature within the
insulation varies, due to the different physical properties of the two types of
insulation.
Back to Roof Insulation System Information
[an error occurred while processing this directive]